



KPIs
Keep an eye on the numbers that matter
KPIs track the health of the business while OKRs drive change. Planomic keeps both in the same place, team by team, and fetches the numbers from Excel, SharePoint and Power BI for you.
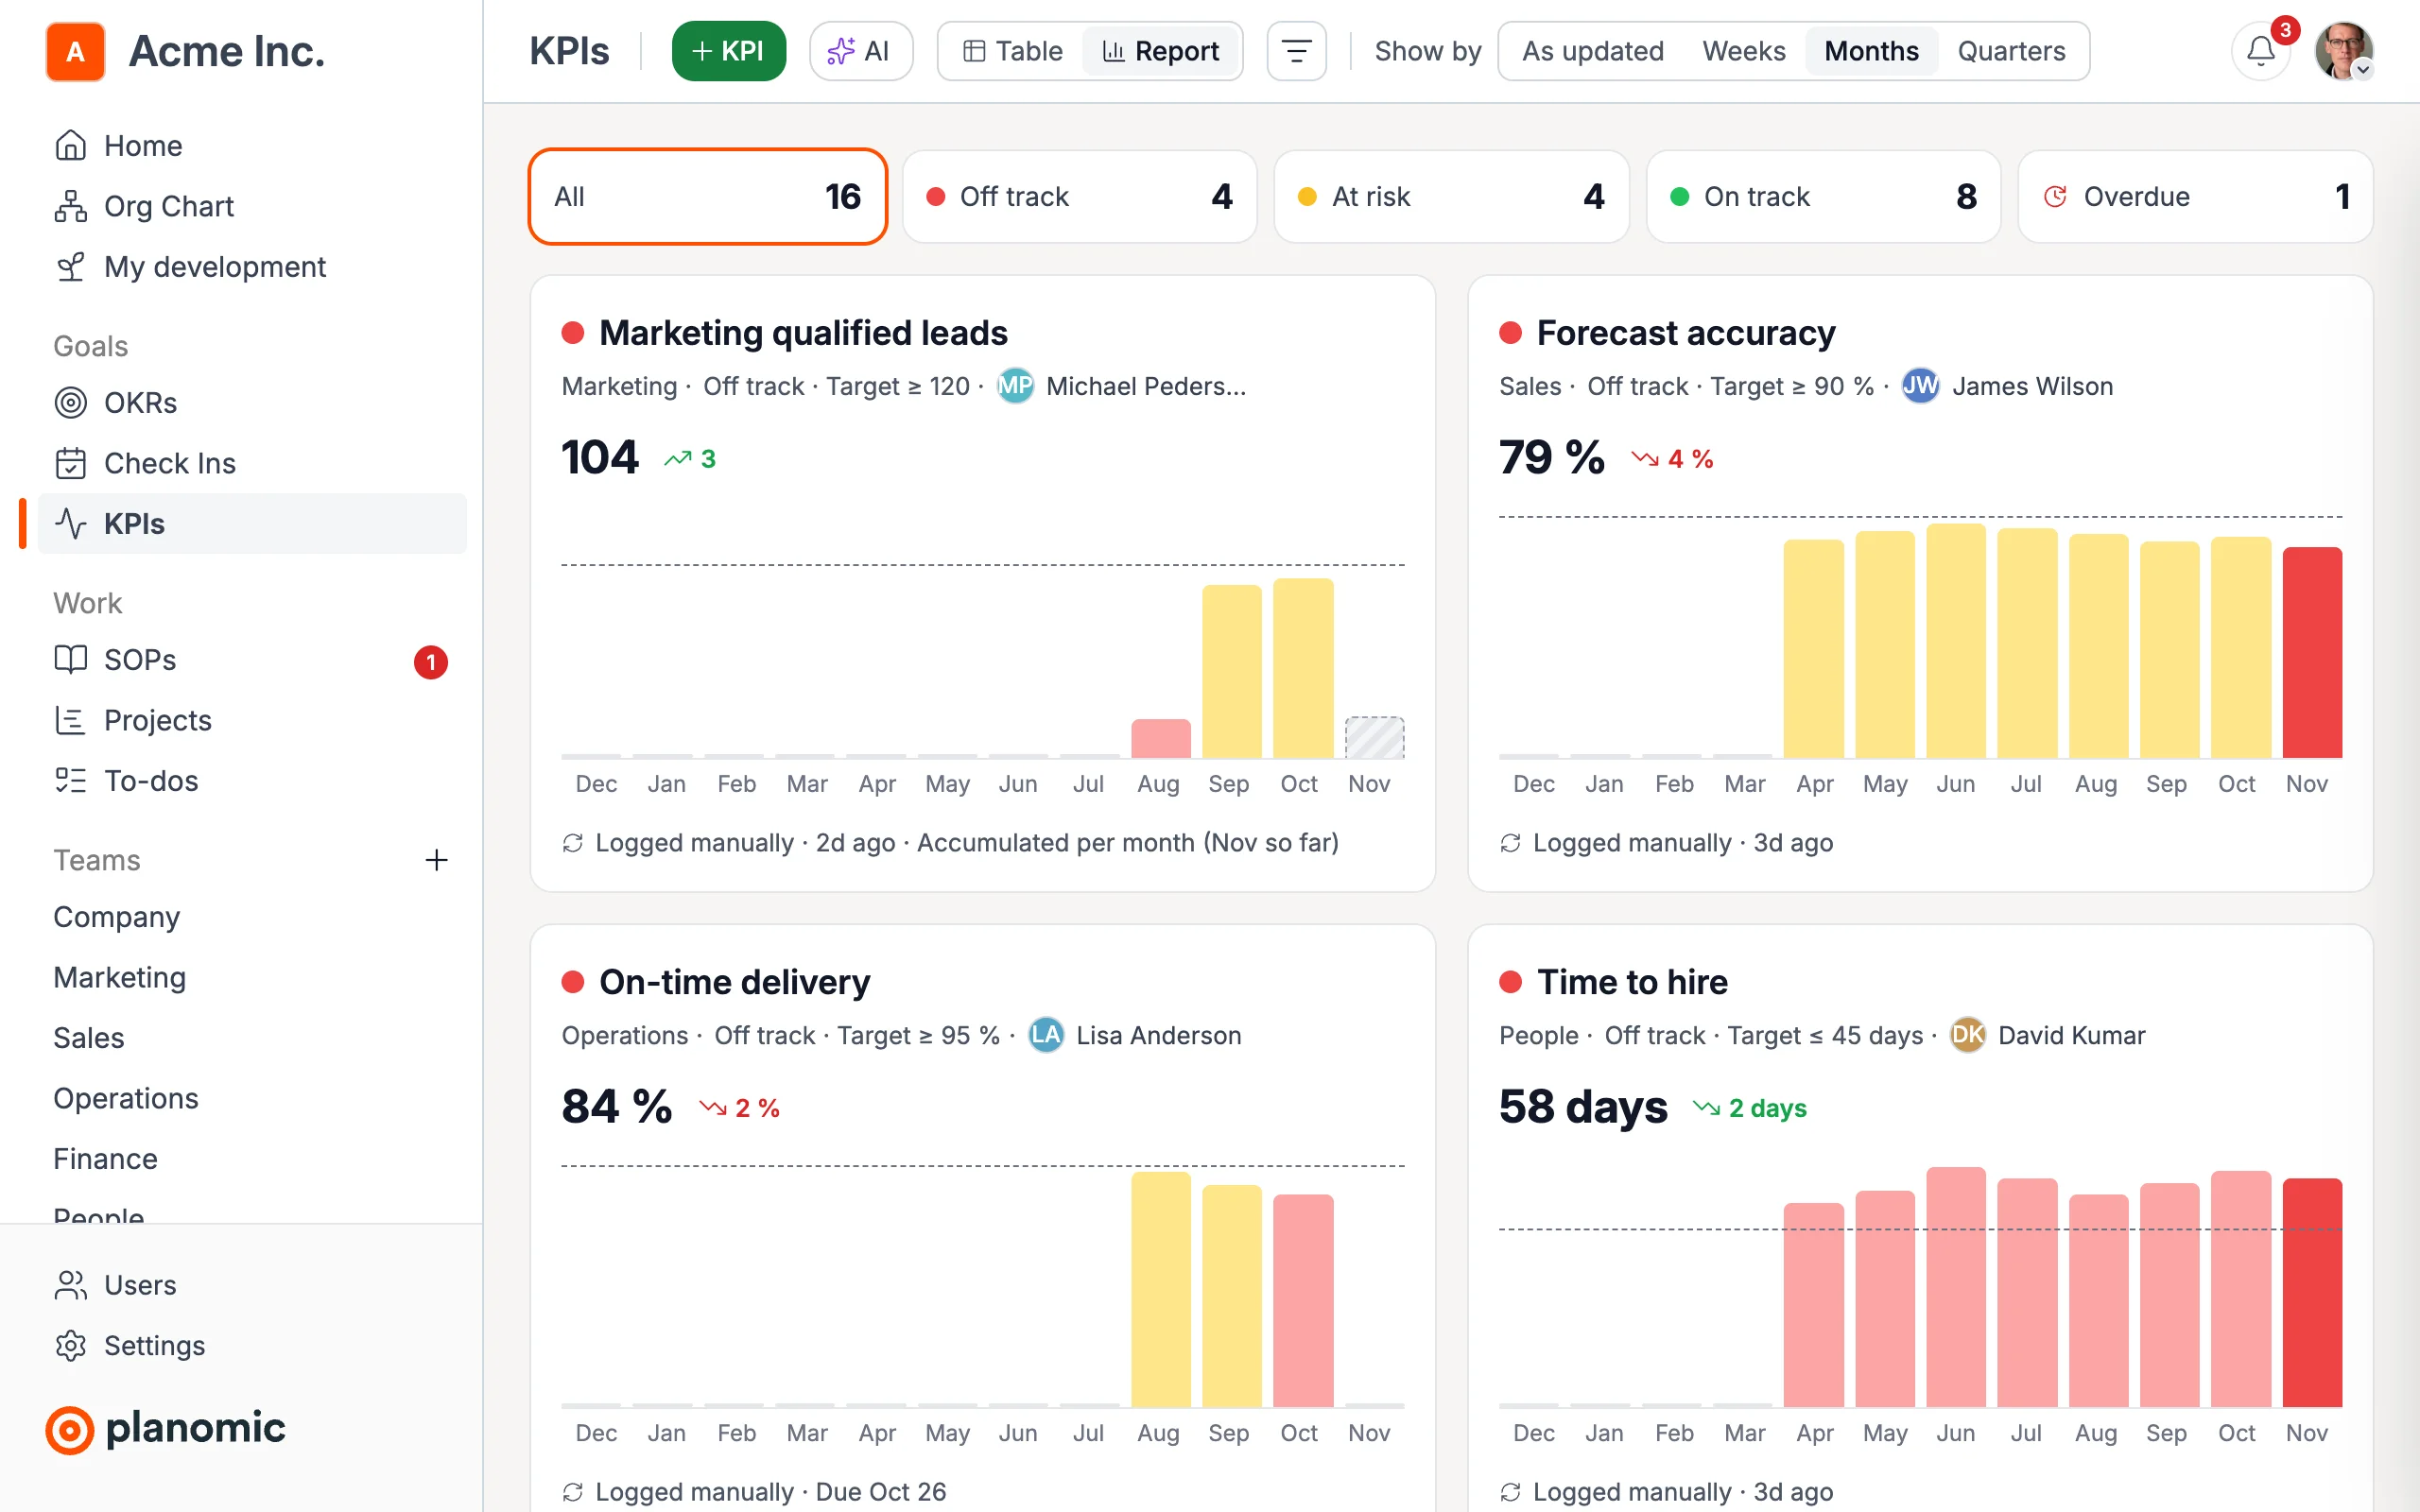
On track at a glance
Set a target and whether higher or lower is better. Planomic shows whether each KPI is on track, at risk or off track.
See the trend
A report shows every KPI with its last 12 weeks, months or quarters, the ones off track first, and whether each period hit the target.
Clear ownership
Every KPI has an owner and a short why, so everyone knows who keeps it healthy and why it matters.
Numbers that arrive by themselves
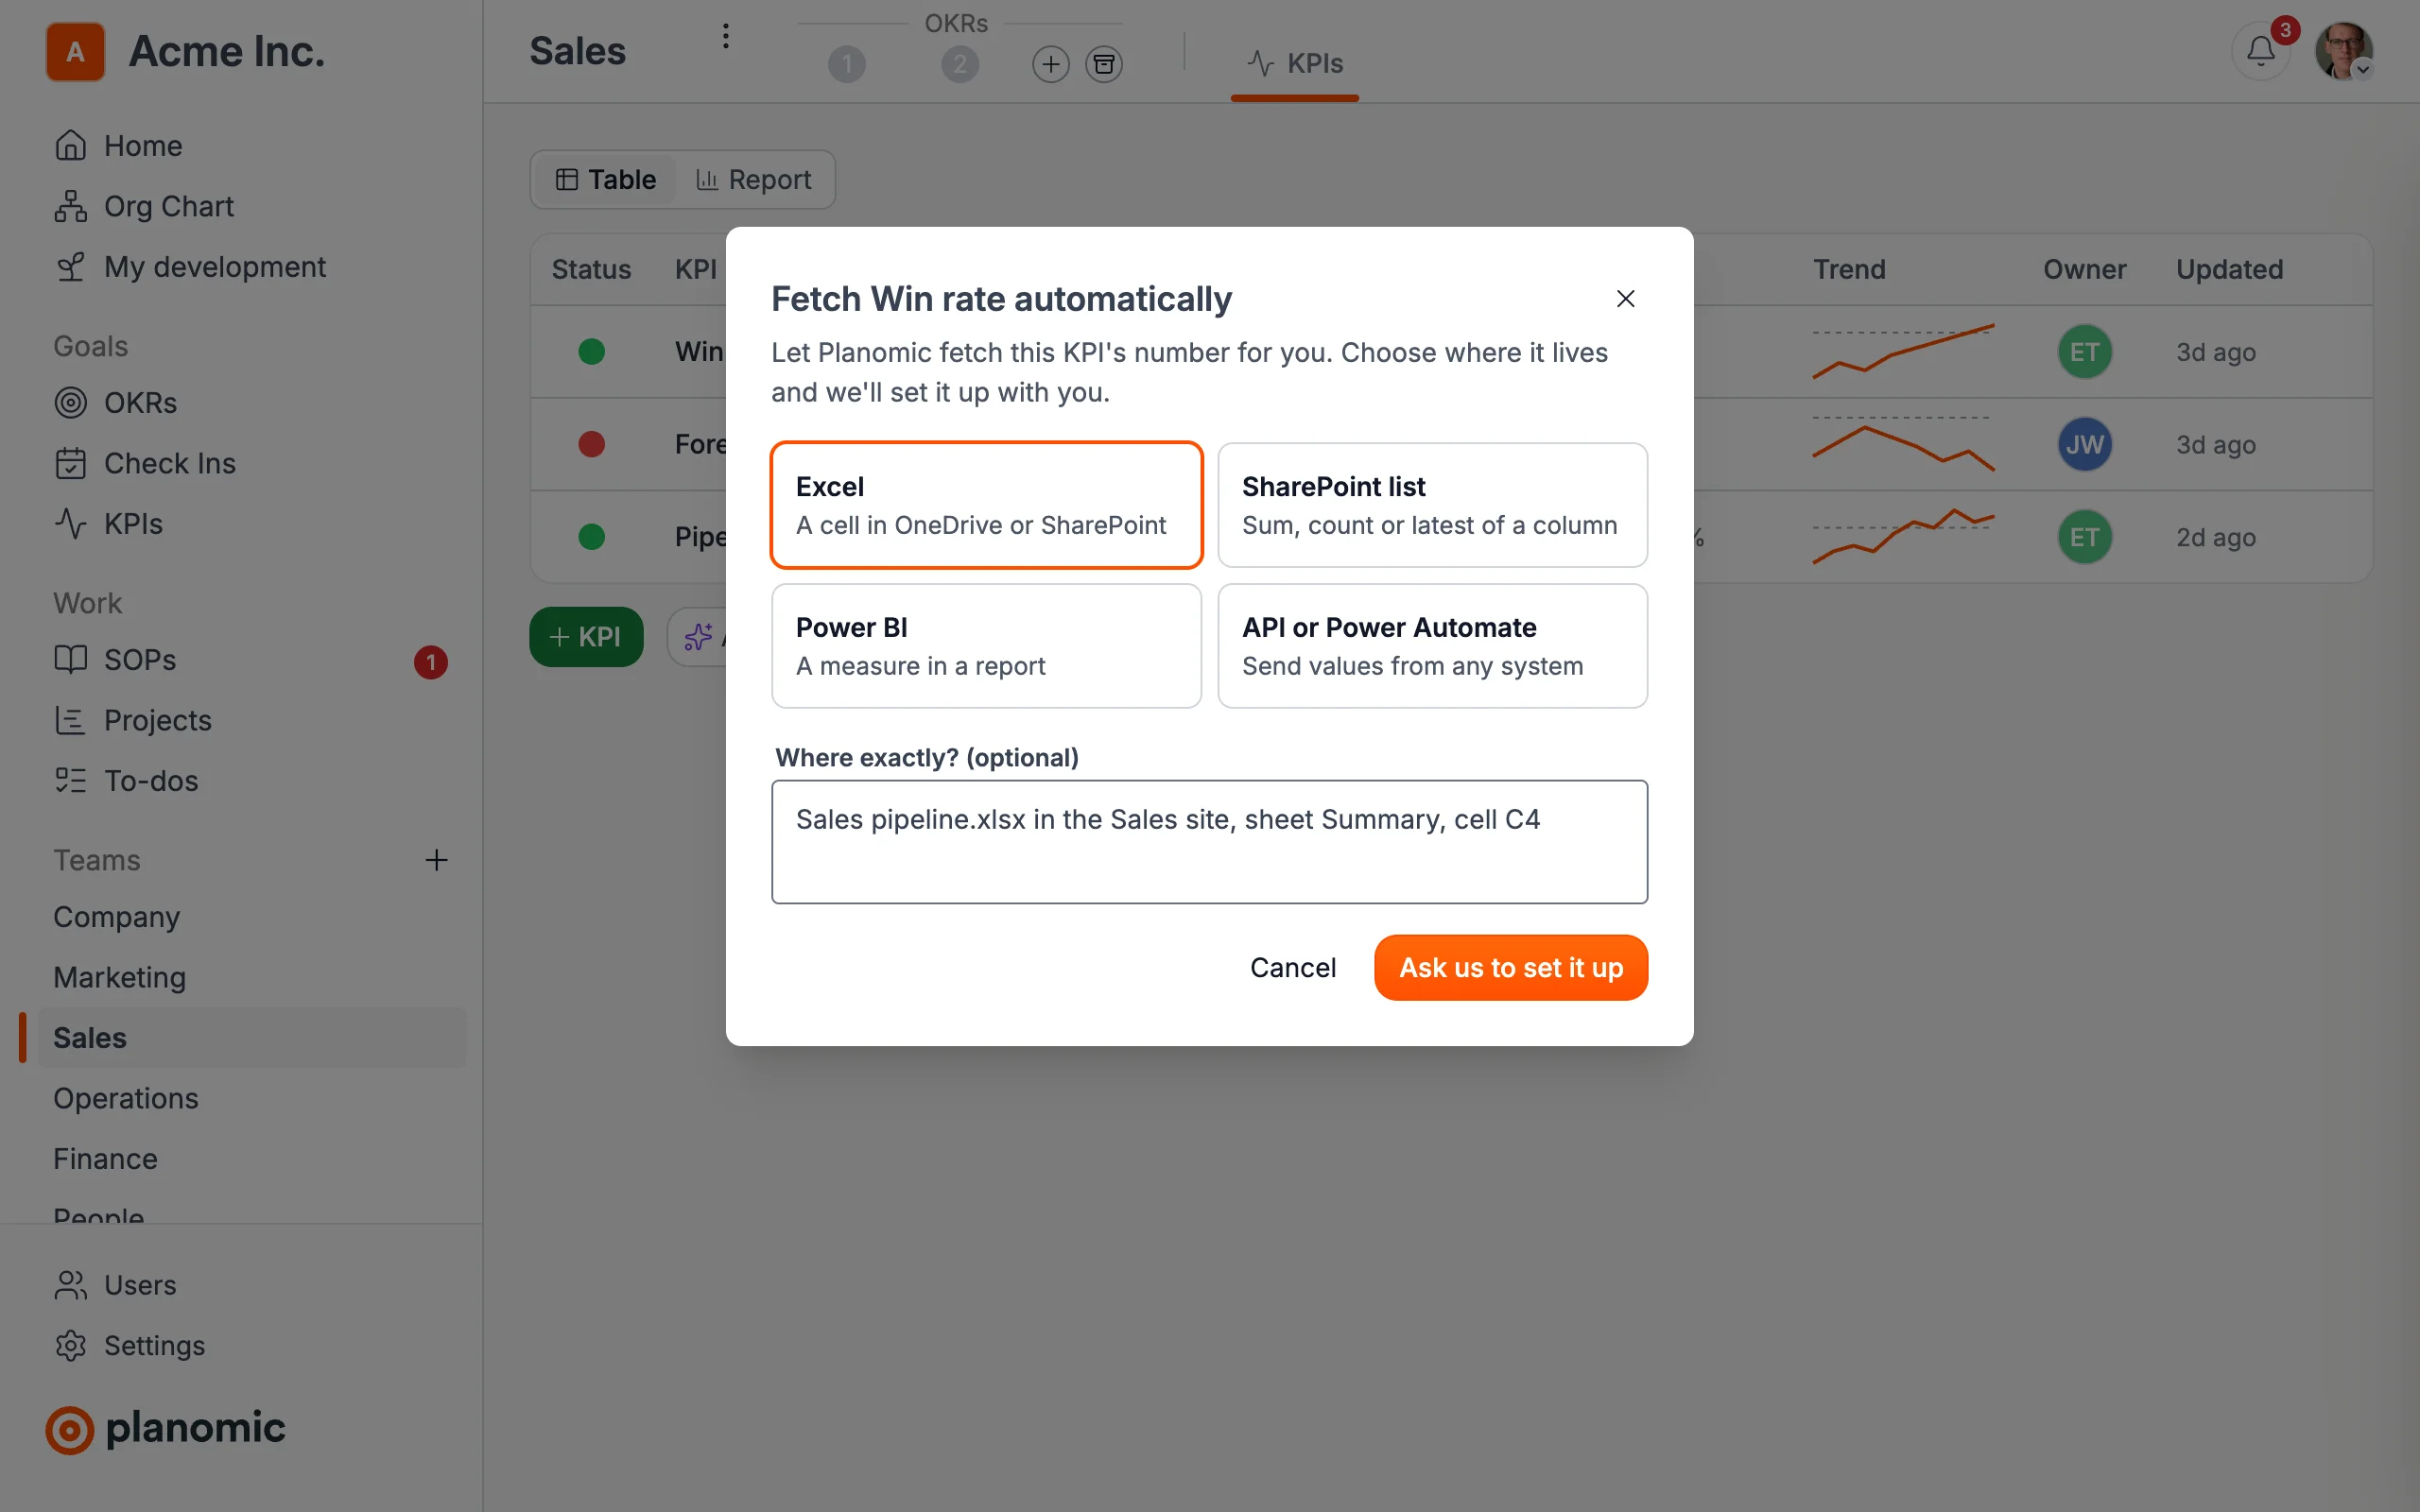
Point a KPI at a cell in Excel, a SharePoint list or a Power BI report, or send values from any system with our API or Power Automate. We set up the connection with you, and nobody types numbers twice.
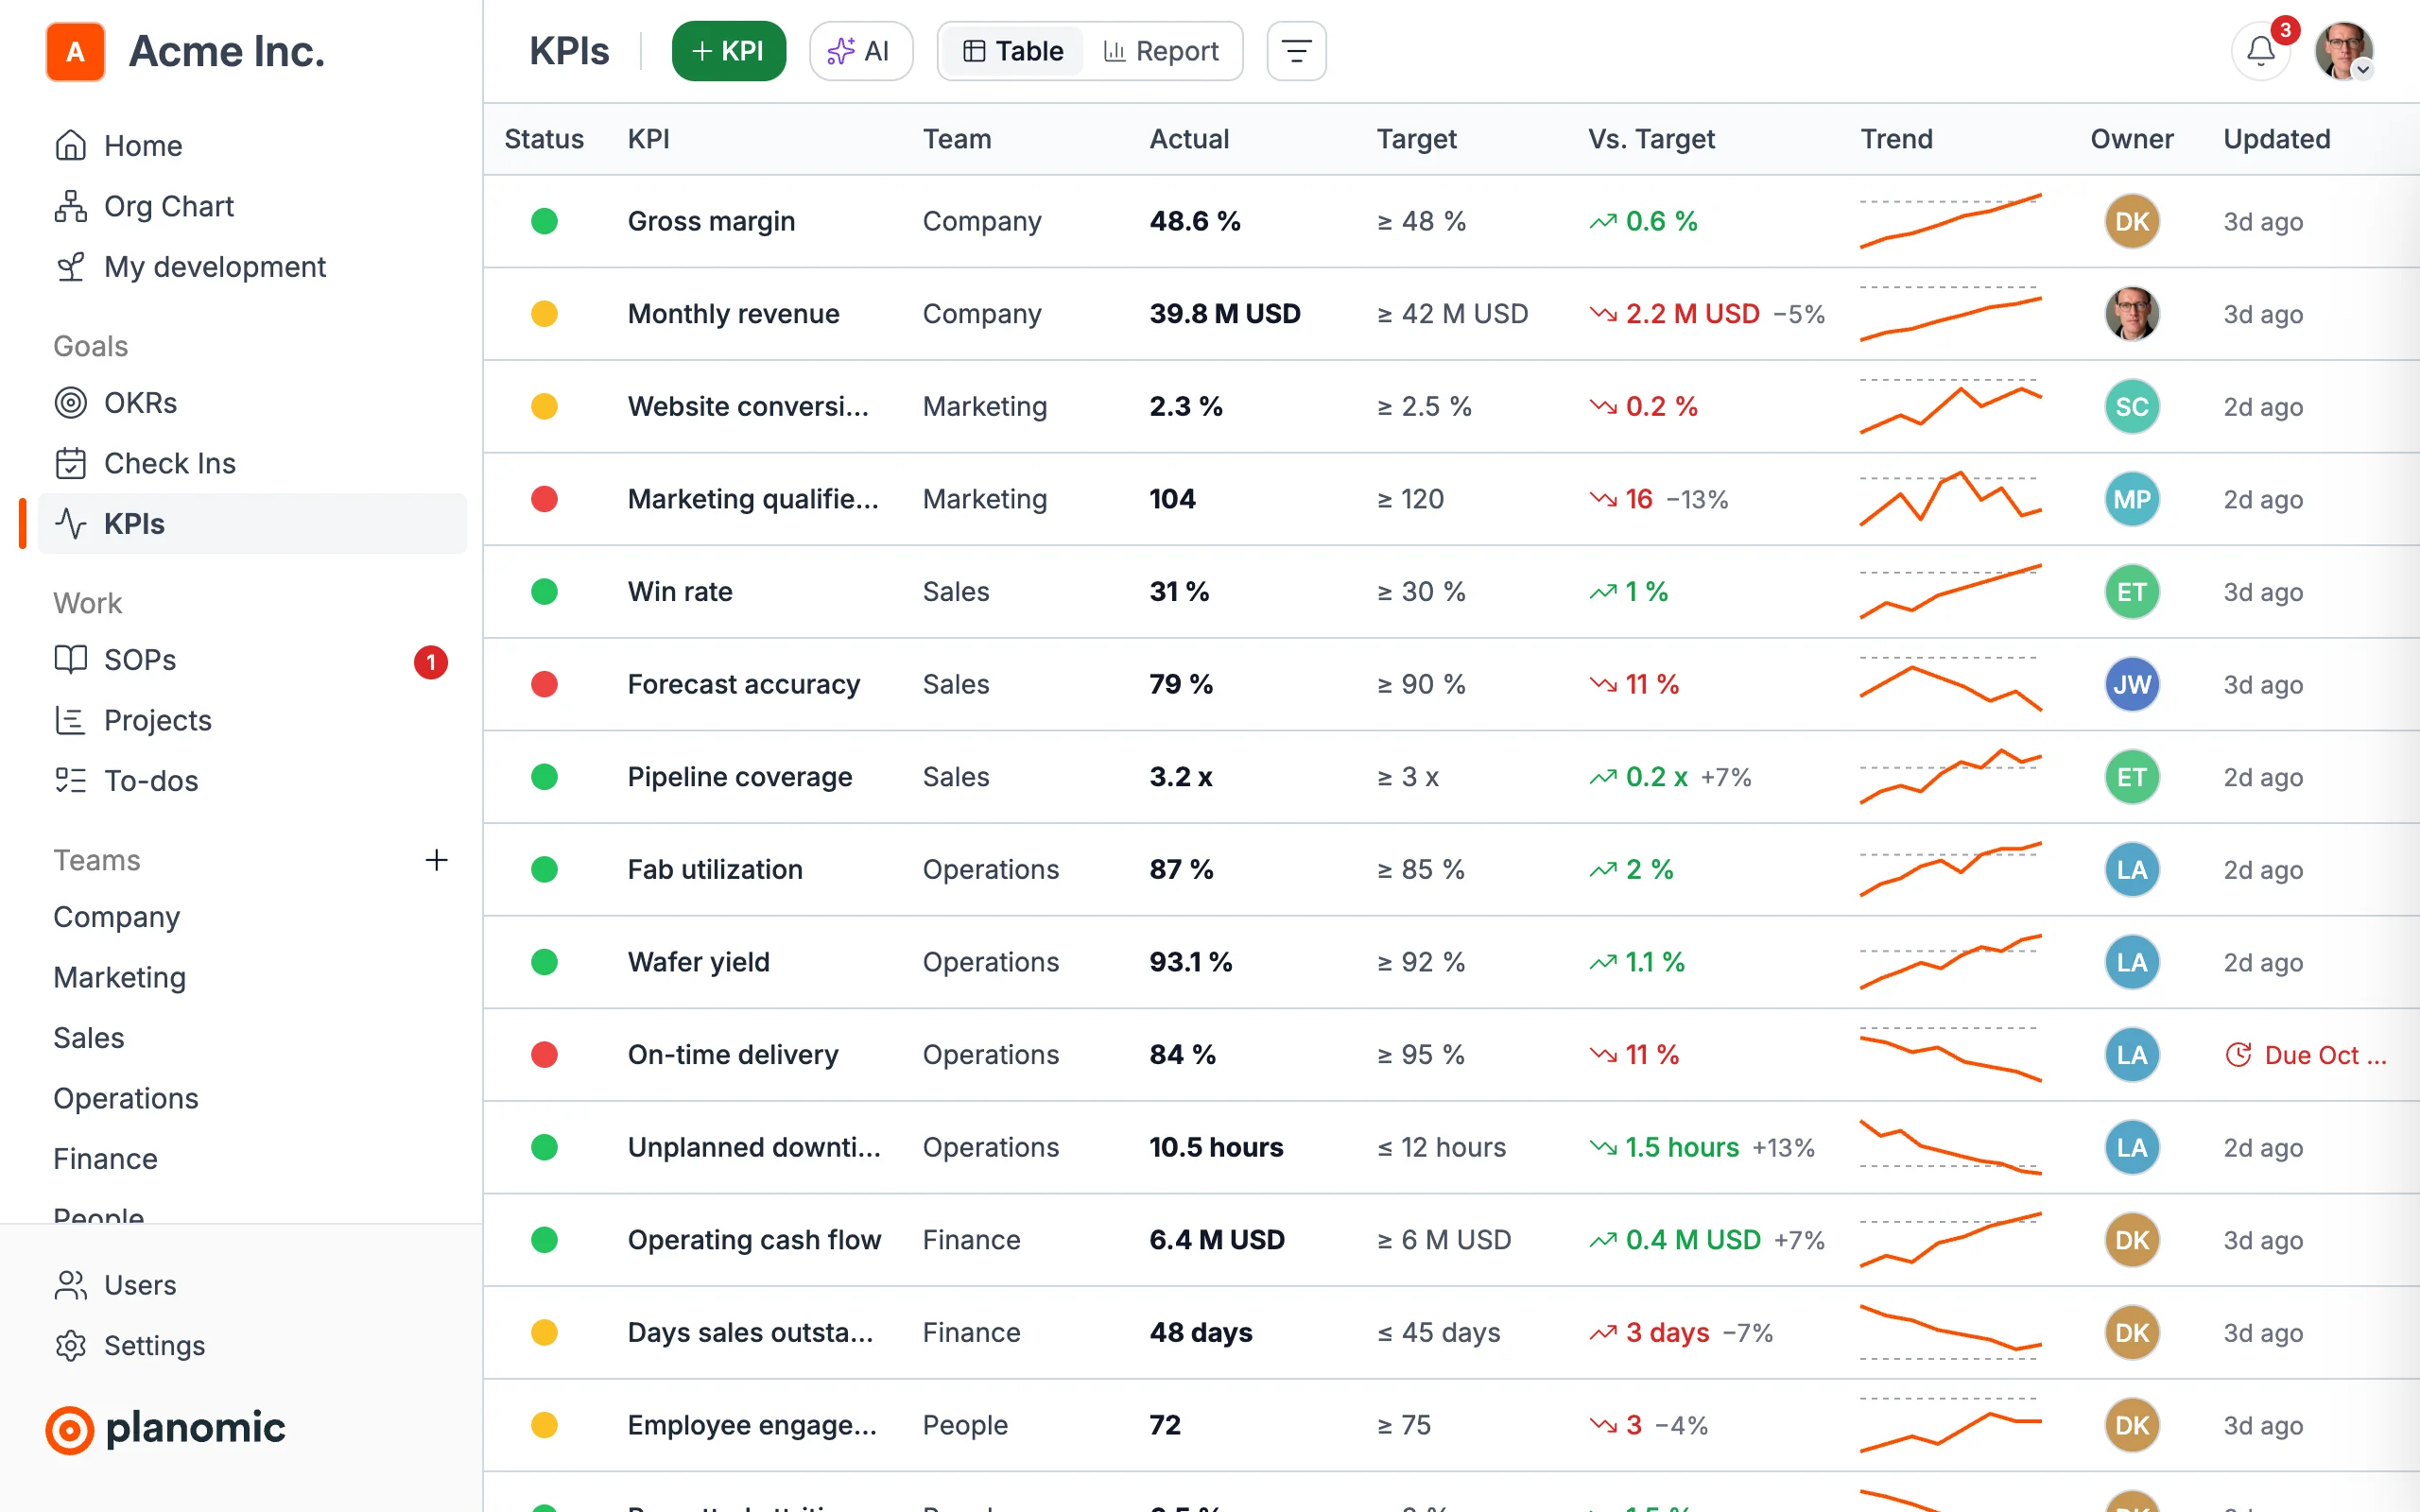
Every KPI in one table
Status, the latest value against the target, the trend and the owner for every KPI in the company, sorted and filtered as you like. Update a value right in the row, or switch to the report.
Fetch the numbers from Excel, SharePoint and Power BI
Point a KPI at a cell in Excel, a SharePoint list or a measure in Power BI, or send values from any system with our API or Power Automate. Choose where the number lives, and we set up the connection with you.
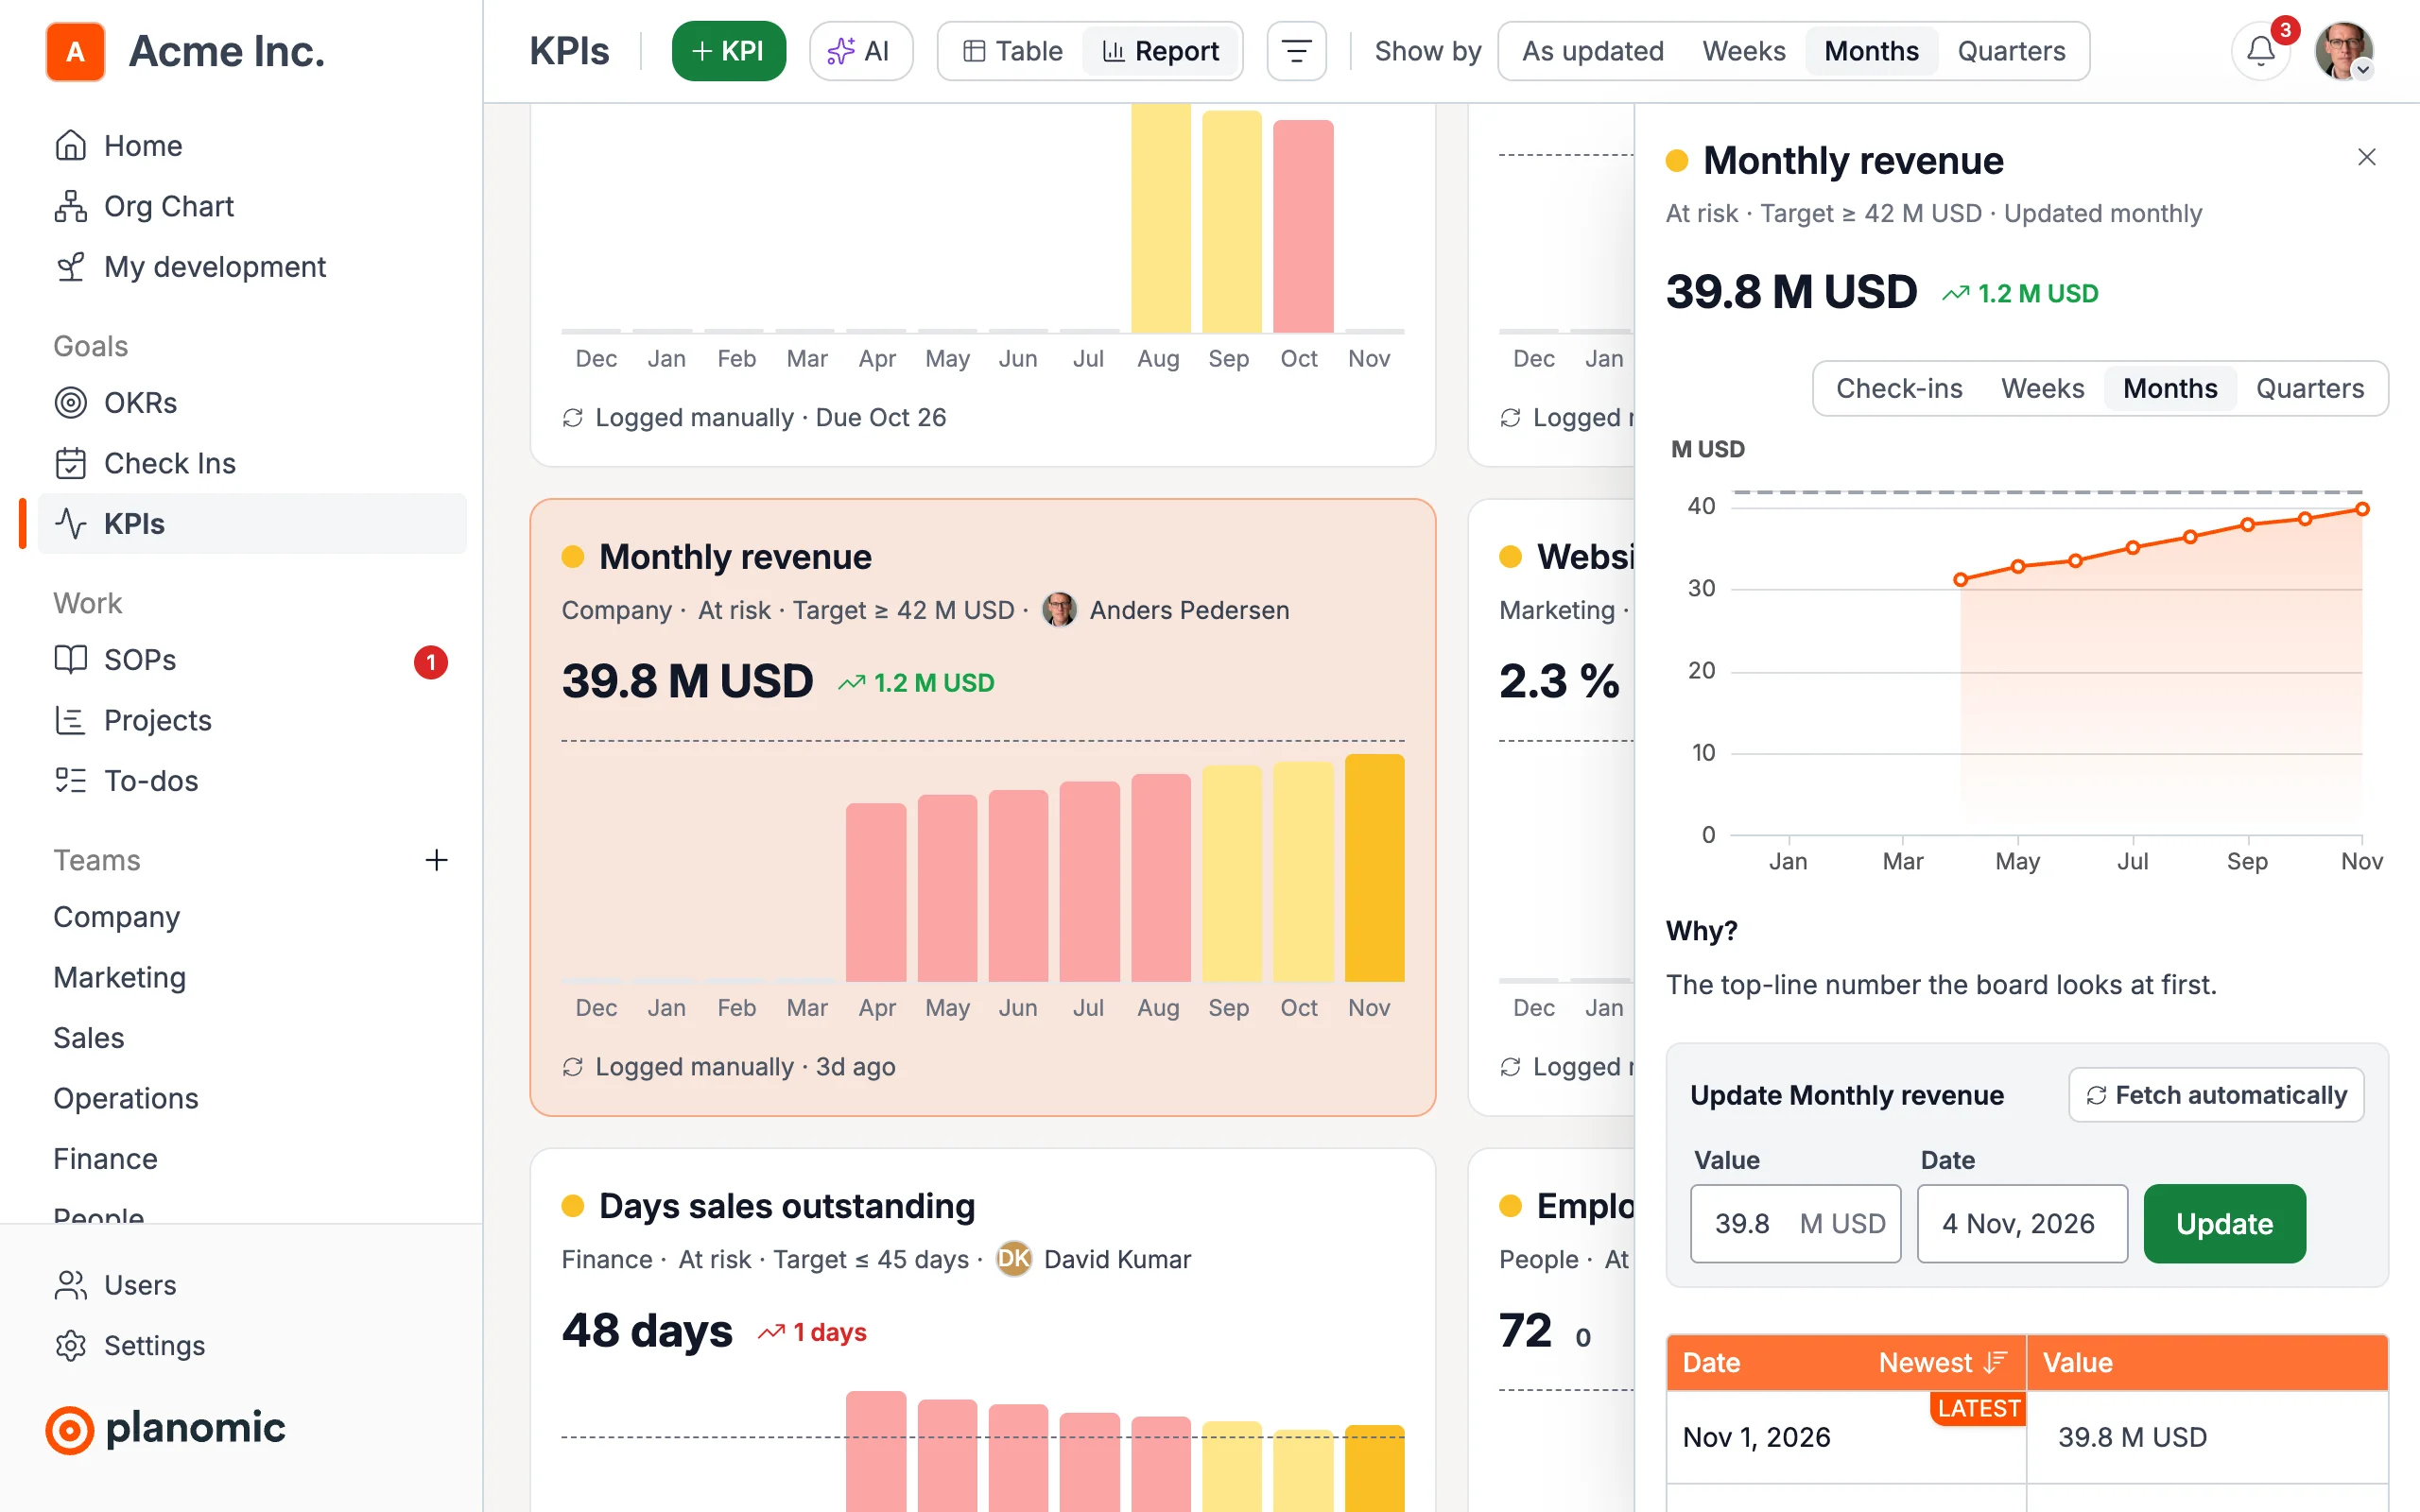
See the whole year, not just the last check-in
The chart on a KPI or key result switches between the check-ins and the last 12 weeks, months or quarters, so a dip this week is seen in the light of the whole year.
Find the right KPIs with AI
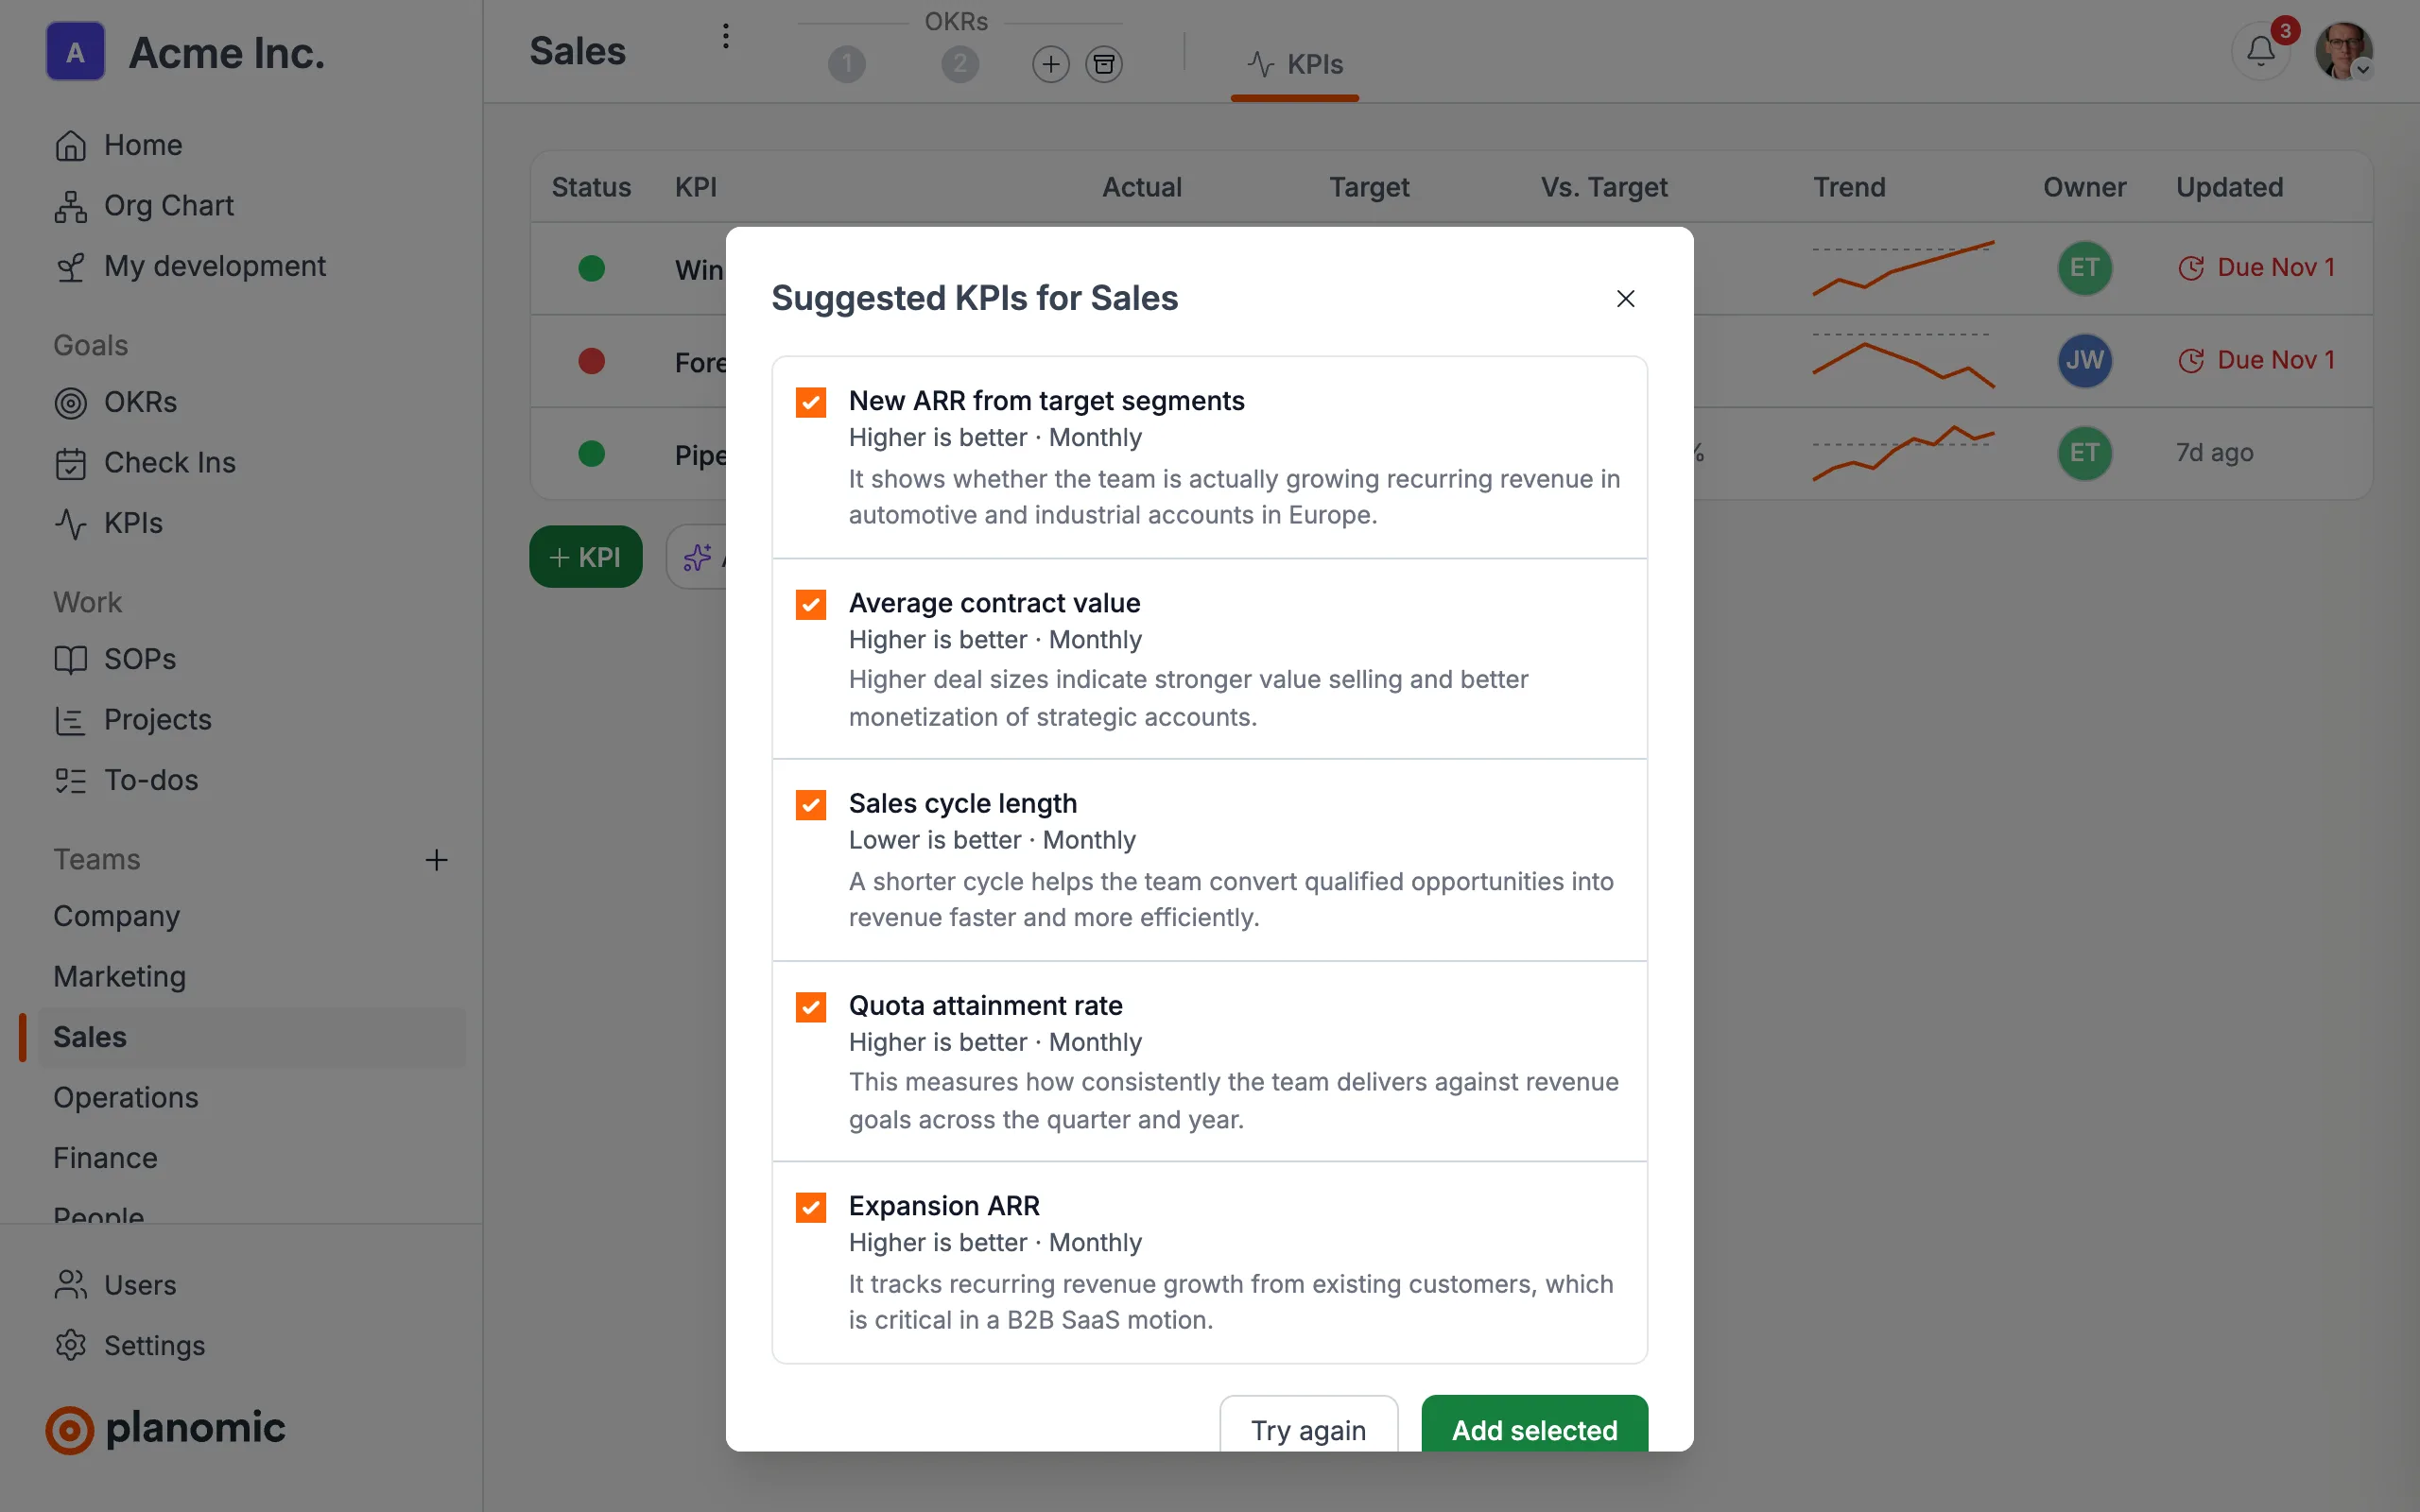
AI suggests KPIs from your industry, the team's OKRs and the KPIs it already tracks, each with a direction, a frequency and why it matters. Tick the ones you want and add them in one go.
Works well with
See Planomic with your own strategy
Book a demo and we'll show you how your teams can go from plan to results.
Book a demo